FY2020 continued to show lower exports as compared to FY2019 in the month of November. While exports declined for a fourth consecutive month, primarily because of poor performance of mineral fuels, ships and cotton. November 2019 saw the least decline as compared to the previous months when comparing with the previous financial year.
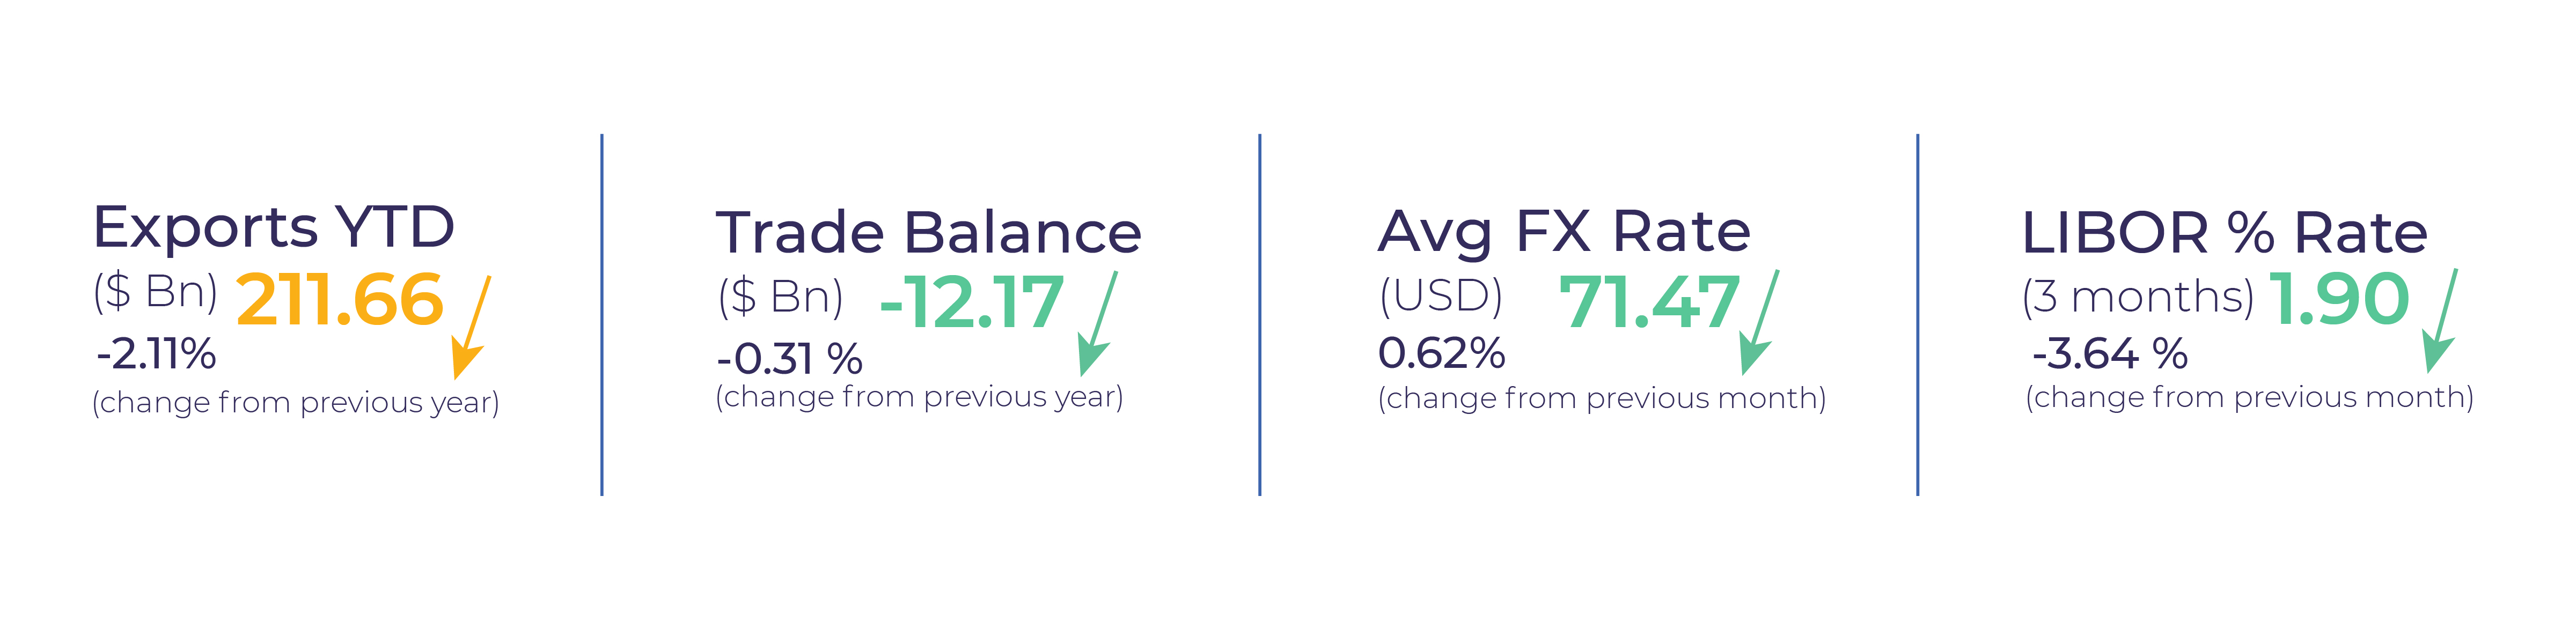
Indian merchandise exports stood at $25.93 billion in the month of November, making YTD exports worth $211.66 billion, 2.11% lower than the previous financial year. Merchandise trade balance value for the month was at $12.17 billion, a minute decrease of 0.31% from the previous year. Meanwhile, the Indian rupee appreciated by 0.62% against the US Dollar and maintained its average value at Rs. 71.47 against the dollar. 3-month LIBOR also declined by 3.64% and had an average value of 1.90%.
Monthly Exports

November saw merchandise exports worth $25.93 billion, with a slight decline of 0.52% from the previous financial year. This is the fifth month in the current financial year in which exports have declined compared to the previous year. There was a decline in the exports of mineral fuels, ships, boats and floating structures, and cotton, but the increase in exports nuclear reactors and machinery and pharma products kept the overall decline in check.
Major Commodities
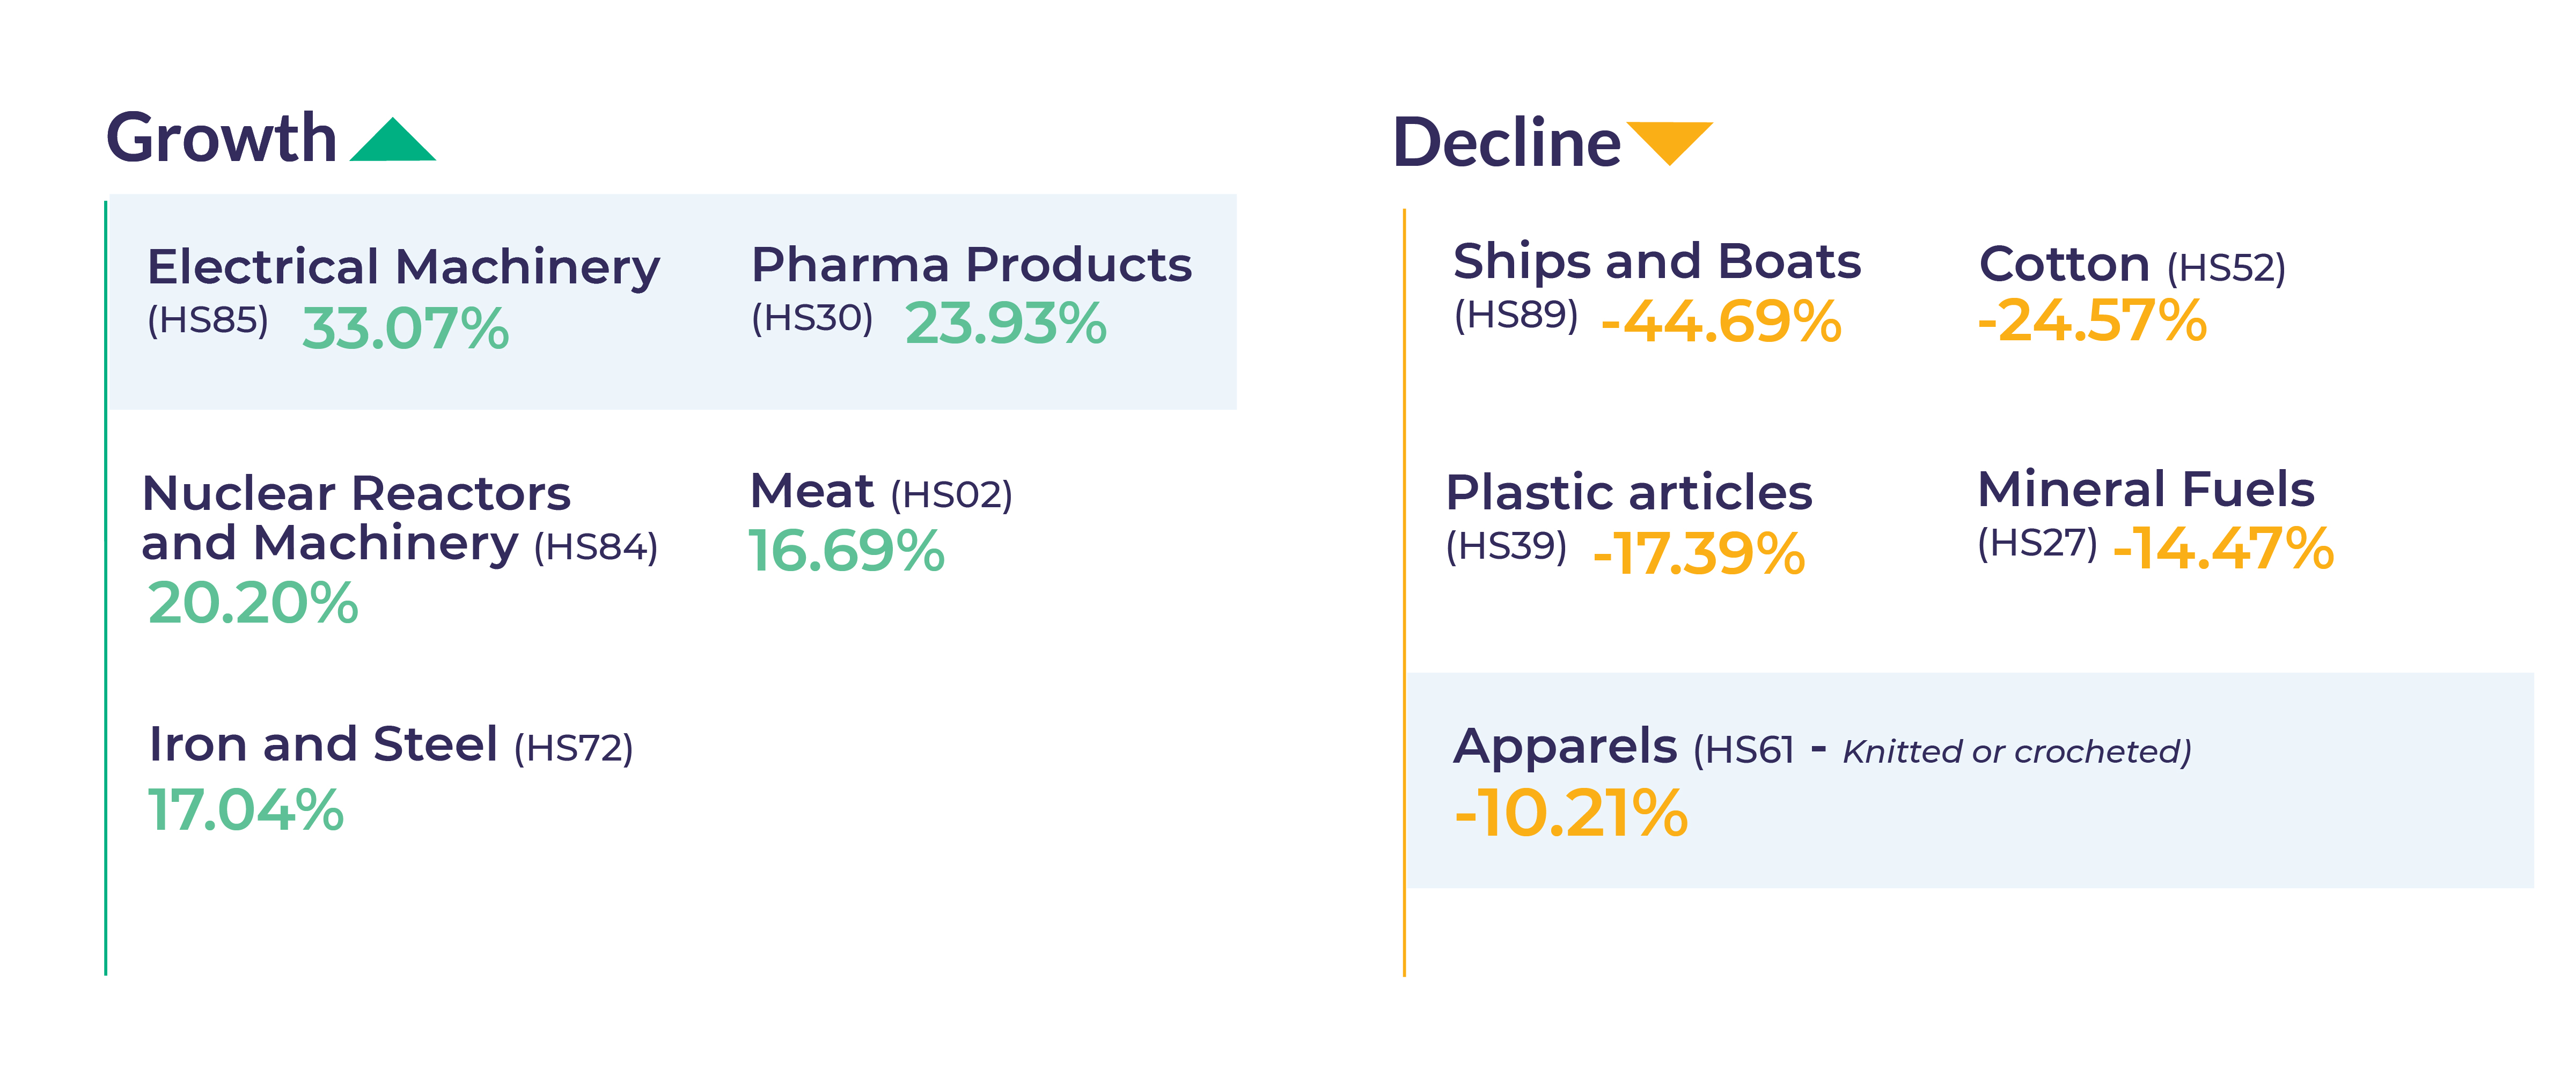
For our review and analysis, we chose major commodities from the top 20 exported commodities in FY19 at an HS-2 level. Out of these, electrical machinery showed the highest growth in terms of export value vis-a-vis the previous year, whereas ships, boats and floating structures showed the highest decline. Other commodities which showed a growth in exports were pharma products, nuclear reactors and machinery, iron and steel, and meat, while cotton, plastic articles, mineral fuels, and apparel also posted declines.
Region-wise Exports

From the six major regions India exports to (North America, West Asia, EU, Northeast Asia, ASEAN, and Southeast Asia), Indian exports to the North American countries registered the highest growth of 14% compared to other regions despite the removal of GSP (Generalized System of Preferences) by the US which brought 94 items under import duty from the earlier duty free regime. Exports also grew to West Asian countries by 6%. However, exports to the European Union, Northeast Asia, ASEAN and South Asia decreased by 8%, 8%, 14% and 15% respectively. North America and West Asia saw a rise in exports primarily due to an increase in exports of electrical machinery and pharma products. On the other hand, the other regions saw a decline because of a decrease in the exports of mineral fuels, cotton and apparels.