Photo: Haris Illahi on Unsplash
What does the US export the most? By individual product, it was civilian aircraft, engines and parts in 2025; by broad category, it was energy. In total, the United States exported $2.18 trillion of goods in 2025, up 5.7% from 2024, according to U.S. Census Bureau trade data (goods only, Census basis). By individual product, the top US exports were civilian aircraft, engines and parts ($153.5 billion), pharmaceutical preparations ($119.2 billion) and crude oil ($98.7 billion). By broad category, energy leads: mineral fuels and oils totaled about $309 billion. Mexico was the largest buyer of US goods, narrowly ahead of Canada.
So what does the US export, and what does that mean for your business? This guide ranks the top 10 US exports by product, explains why the answer changes when you group products by category, shows who buys them, and covers the 2026 figures and tariffs exporters need to plan around. Rankings use 2025 data, the latest full year available, with 2026 year-to-date figures where they matter.
| US exports at a glance | |
|---|---|
| Total goods exports, 2025 | $2.18 trillion (up 5.7% from $2.06 trillion in 2024) |
| Largest export product (end-use category) | Civilian aircraft, engines and parts, $153.5B |
| Largest broad category (HS chapter 27) | Mineral fuels and oils, about $309B |
| Largest buyer | Mexico, $337.3B (15.5% of US goods exports) |
| 2026 so far (January to September) | $1.85 trillion, up 14.3% year over year |
Top 10 US Exports: What the US Exported Most in 2025
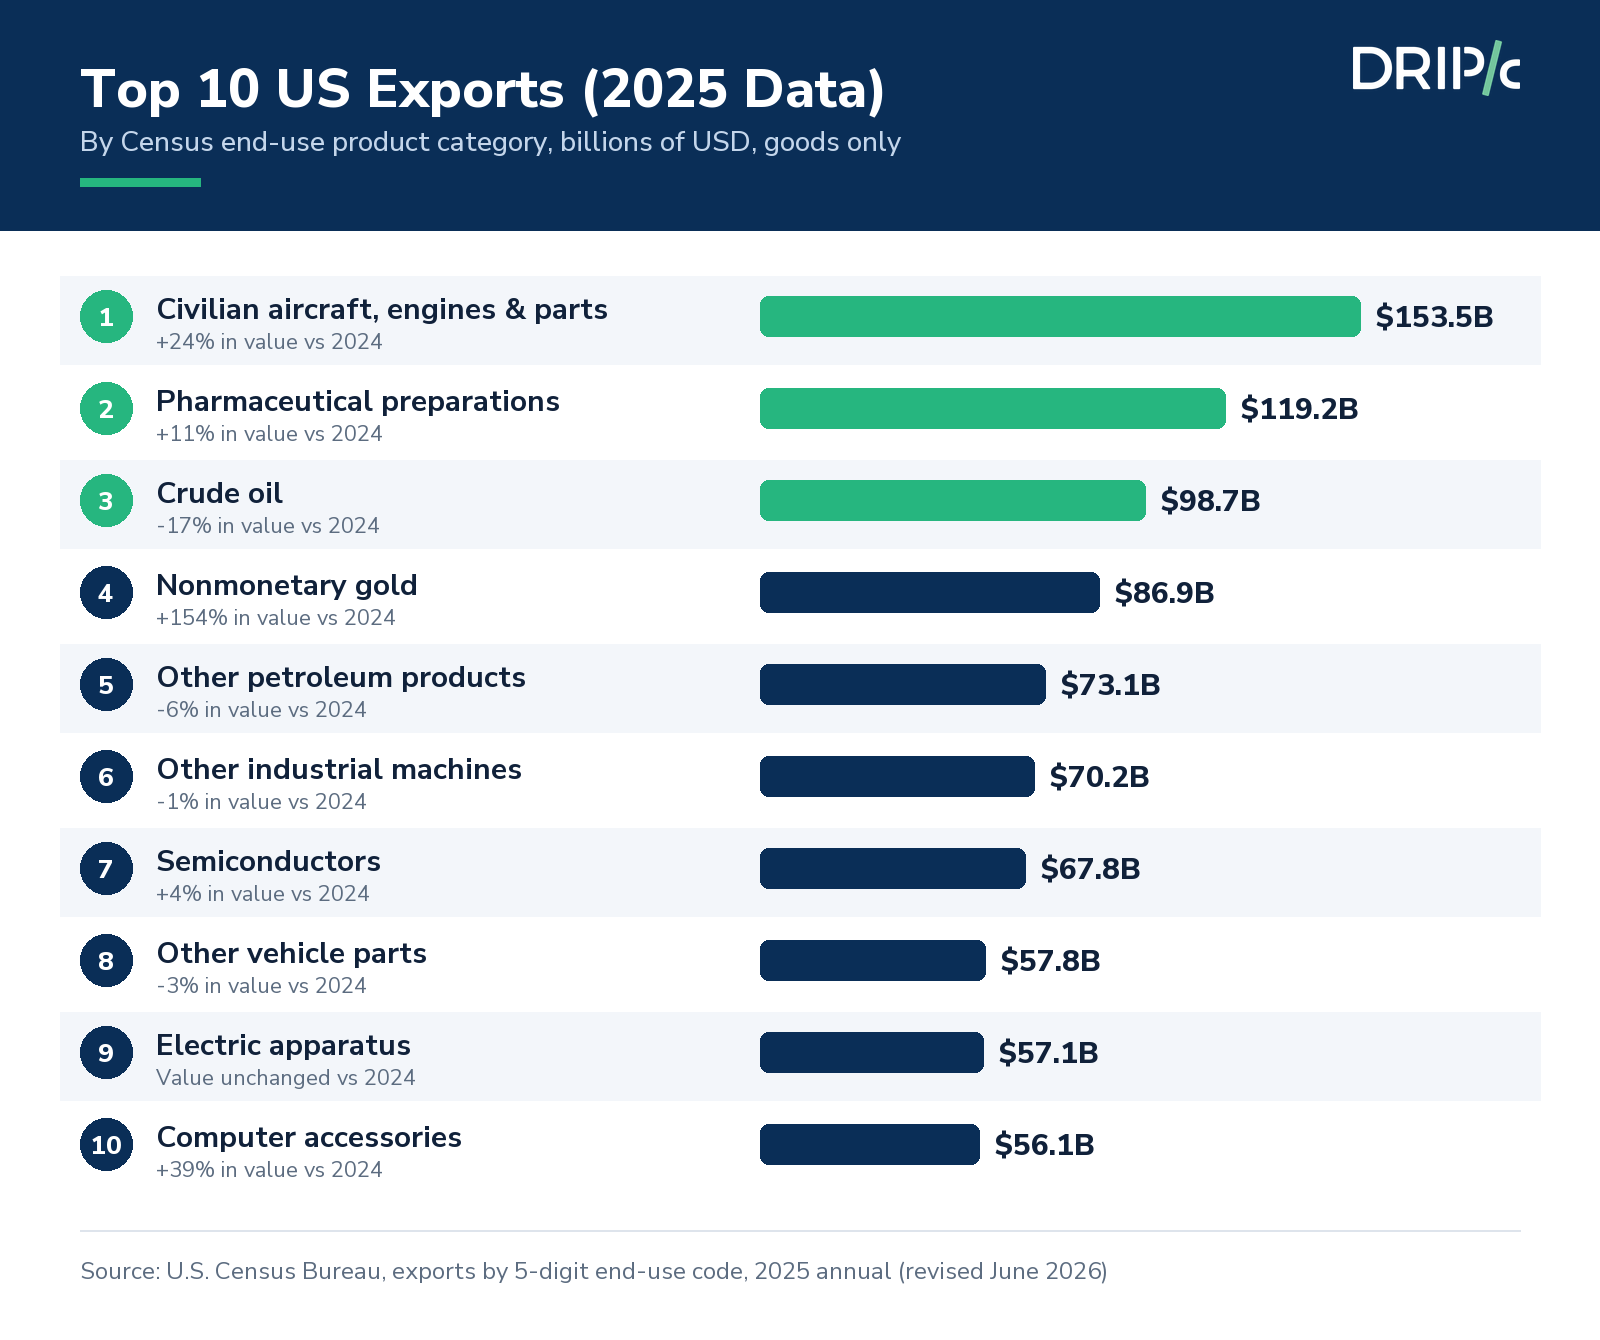
The table ranks the biggest US exports of 2025 using the Census Bureau's end-use product categories, which group goods by what they are used for. Changes are in dollar value, so they reflect both prices and volumes.
| Rank | Product (end-use category) | 2025 exports | Change vs 2024 | Top buyer (share) |
|---|---|---|---|---|
| 1 | Civilian aircraft, engines and parts | $153.5B | +23.7% | China (10%) |
| 2 | Pharmaceutical preparations | $119.2B | +10.7% | Italy (15%) |
| 3 | Crude oil | $98.7B | −16.9% | Netherlands (22%) |
| 4 | Nonmonetary gold | $86.9B | +153.9% | Switzerland (55%) |
| 5 | Other petroleum products | $73.1B | −6.0% | Mexico (28%) |
| 6 | Other industrial machines | $70.2B | −1.2% | Canada (15%) |
| 7 | Semiconductors | $67.8B | +4.5% | Mexico (27%) |
| 8 | Other vehicle parts and accessories | $57.8B | −2.8% | Mexico (40%) |
| 9 | Electric apparatus | $57.1B | 0.0% | Mexico (35%) |
| 10 | Computer accessories | $56.1B | +38.6% | Mexico (50%) |
Source: U.S. Census Bureau, exports by 5-digit end-use code, 2025 annual, revised June 2026. Excludes "minimum value shipments" ($54.7B), a catch-all for low-value parcels rather than a product.
What Does the US Export the Most? It Depends on How You Group Products
Ask what does the US export the most and you can get two correct answers. In the Census end-use view, civilian aircraft, engines and parts rank first because that category bundles finished planes, engines and parts. In the Harmonized System (HS) view that customs authorities use, crude oil, refined fuels and natural gas sit together in chapter 27, which makes energy the largest category. Neither ranking is wrong; they answer different questions.
| Rank | HS chapter | What it includes | 2025 exports |
|---|---|---|---|
| 1 | 27 | Mineral fuels and oils (crude oil, refined fuels, LNG, coal) | $308.9B |
| 2 | 84 | Machinery, computers and engines | $283.6B |
| 3 | 85 | Electrical machinery, chips and phones | $226.0B |
| 4 | 88 | Aircraft, spacecraft and parts | $164.3B |
| 5 | 71 | Precious metals and stones, including gold | $148.0B |
Source: UN Comtrade, US-reported exports by HS chapter, 2025. Totals differ slightly from Census figures because of classification and revision timing.
A Closer Look at the Five Biggest US Exports
Civilian aircraft, engines and parts ($153.5 billion, +23.7%). The single largest product category among US top exports. Buyers are spread worldwide: China (10%), France (10%) and Germany (8%) took the largest shares.
Pharmaceutical preparations ($119.2 billion, +10.7%). Europe dominates demand, led by Italy ($17.8 billion), Germany ($12.3 billion) and the Netherlands ($9.7 billion).
Crude oil ($98.7 billion, −16.9%). Still a top-three export despite a lower dollar value in 2025. The Netherlands (22%), South Korea (13%) and Canada (9%) were the main destinations.
Nonmonetary gold ($86.9 billion, +153.9%). The fastest-growing of the top 10 in dollar terms, up from $34.2 billion. More than half went to Switzerland ($47.9 billion) and more than a fifth to the United Kingdom ($19.6 billion). Gold prices also rose sharply: the World Gold Council reports that the average LBMA gold price was a record $3,431 an ounce in 2025, up 44% from 2024. So part of the jump reflects higher prices, not only more gold shipped, and the Census figures alone cannot separate the two.
Other petroleum products ($73.1 billion, −6.0%). This Census category covers petroleum products other than crude oil, fuel oil and natural gas liquids. Mexico and Canada together bought 46% (28% and 18%).
Who Buys US Exports? Top 10 Destinations in 2025
| Rank | Country | 2025 US exports | Share | Change vs 2024 |
|---|---|---|---|---|
| 1 | Mexico | $337.3B | 15.5% | +0.8% |
| 2 | Canada | $333.6B | 15.3% | −4.8% |
| 3 | China | $106.0B | 4.9% | −26.0% |
| 4 | United Kingdom | $97.4B | 4.5% | +22.5% |
| 5 | Netherlands | $93.9B | 4.3% | +6.7% |
| 6 | Germany | $82.8B | 3.8% | +9.4% |
| 7 | Japan | $81.4B | 3.7% | +3.2% |
| 8 | Switzerland | $73.7B | 3.4% | +195.8% |
| 9 | South Korea | $69.1B | 3.2% | +5.0% |
| 10 | Taiwan | $54.8B | 2.5% | +28.9% |
Source: U.S. Census Bureau, exports by end-use code and country, 2025 annual, revised June 2026; see also the country pages for Mexico, Canada and China.
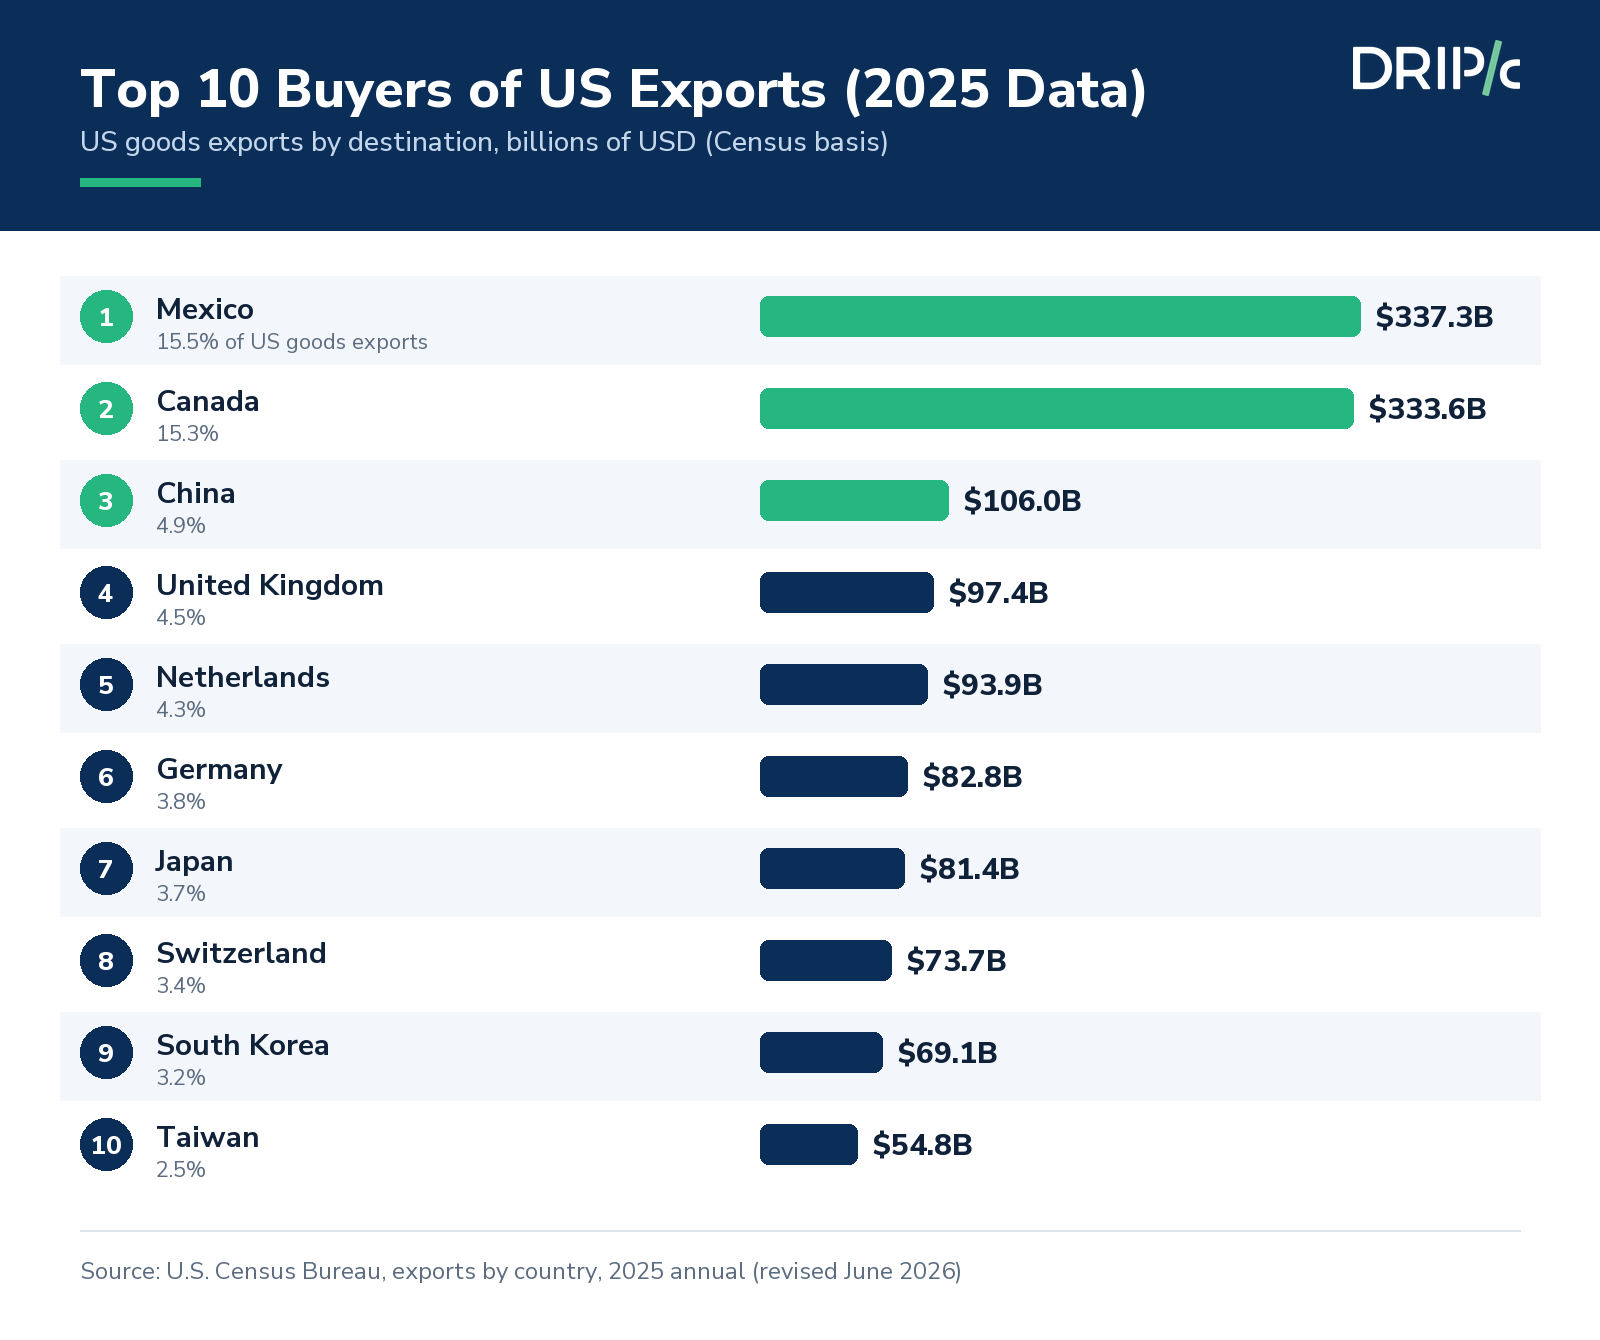
Three shifts stand out. Mexico overtook Canada as the largest buyer of US goods (in 2024 Canada led, $350.6 billion to $334.5 billion), and together the two neighbors bought 30.8% of all US goods exports. Exports to China fell 26%, cutting China's share to 4.9% from 6.9%. And Switzerland's purchases nearly tripled: gold made up $47.9 billion of its $73.7 billion total.
For exporters, the takeaway is that Mexico and Canada are the two largest individual markets, and Mexico is the top buyer for five of the top US exports. If your buyers pay on terms, plan your cash cycle around the time between paying your vendors and getting paid.

The next question is how the picture is changing in 2026, and which trade rules now affect these markets.
US Exports in 2026 So Far
Total US goods exports kept growing in 2026, a trend that matters for anyone selling the top US exports. From January through September, US goods exports totaled $1.85 trillion, up 14.3% from $1.62 trillion a year earlier, according to the Census Bureau's September 2026 trade release. Exports to Mexico reached $297.6 billion (up 17.6%), exports to Canada $265.9 billion (up 4.9%) and exports to China $83.5 billion, up 2.1%. For context, 2025's total was the highest in the 2016 to 2025 Census series, above the previous high of $2.07 trillion in 2022.
Tariffs and Trade Rules US Exporters Face in 2026
These trade actions affect US exporters as of November 3, 2026:
• Canada: Canada has applied counter-tariffs on about C$27.6 billion of US goods since September 8, 2026, on top of earlier tariffs on US vehicles and on C$15.6 billion of US steel and aluminum, according to the Congressional Research Service. See our Canada tariffs update.
• China: on September 25, 2026, the US and China agreed on recommendations for more favorable tariff treatment of $30 billion of non-sensitive goods in each direction, including US agricultural goods, under a new Board of Trade (White House). These are recommendations, not final tariff cuts, so check China's current rate for your product before you quote.
• Mexico: Since January 1, 2026, Mexico has charged higher tariffs, averaging about 35% and up to 50%, on about 1,463 tariff lines for goods from countries without a trade agreement with Mexico, such as China, South Korea and India (Secretaría de Economía; trade.gov). Goods that qualify for USMCA treatment are not covered.
• USMCA: At the July 1, 2026 joint review, the US did not agree to renew the agreement in its current form. USMCA remains in force, but under Article 34.7 the three countries now review it every year, and it will expire in 2036 unless all three agree to extend it. Read more about the USMCA agreement.
For US import duty rates by country, see our tariff pages for Canada, Mexico and China.
Which Export Market Should You Start With?
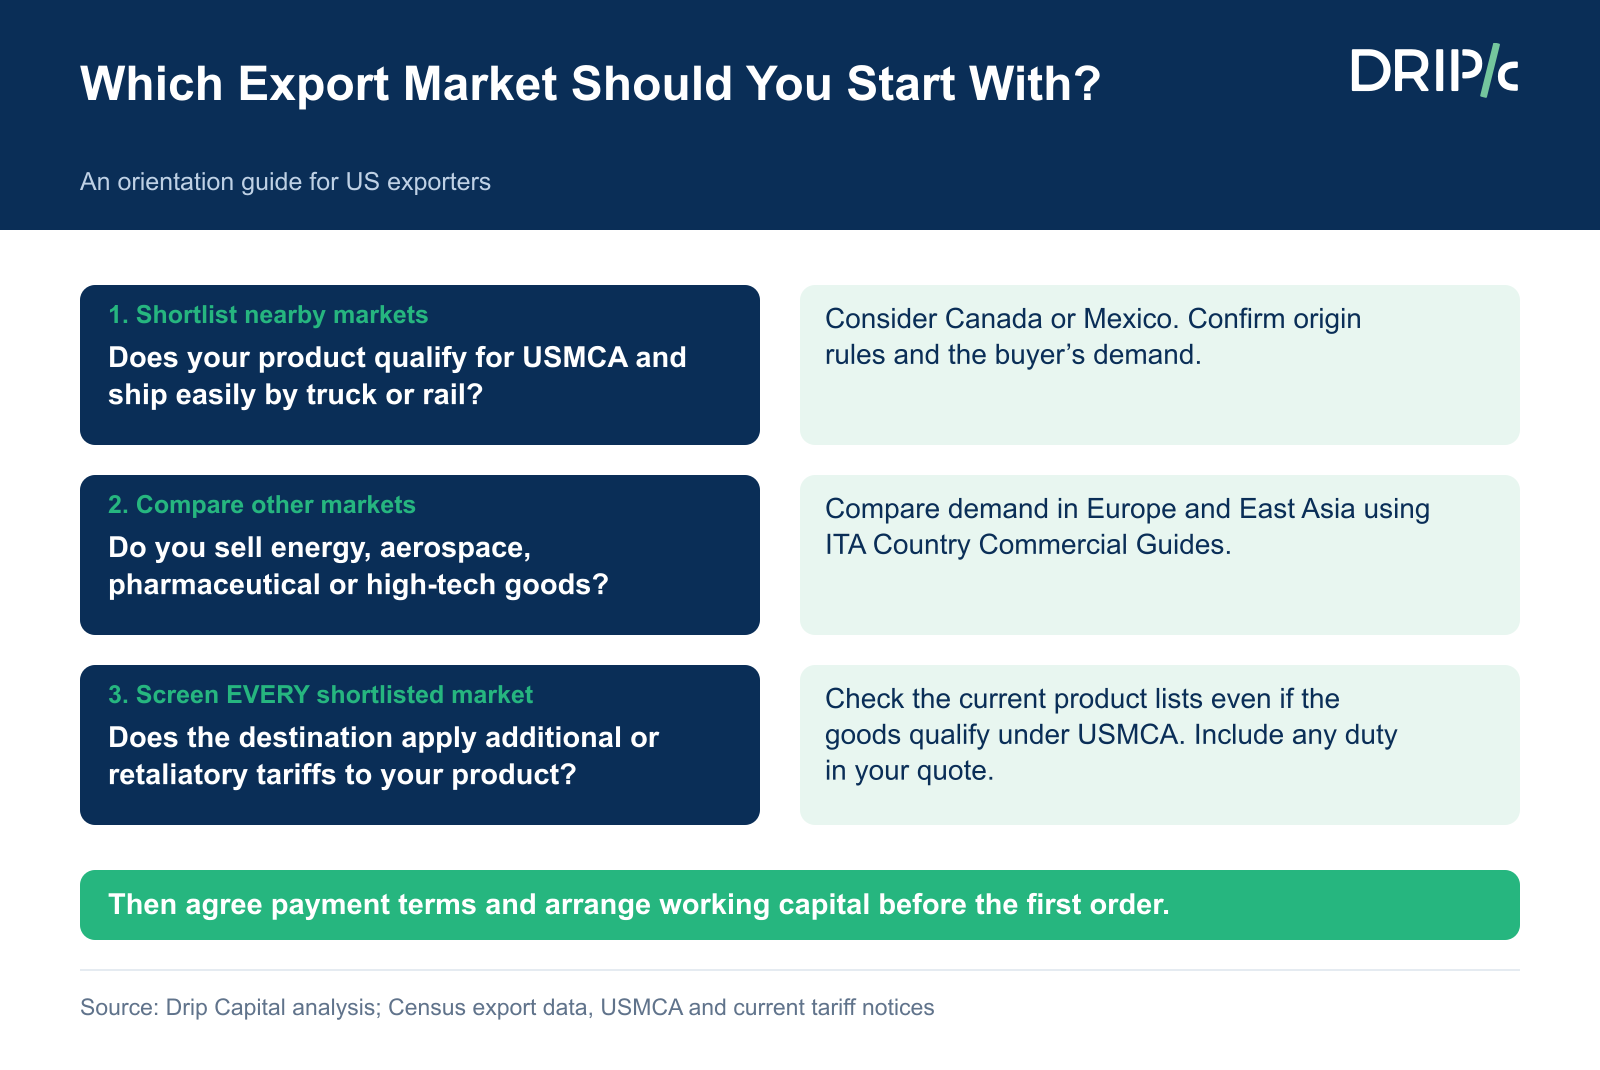
If you are new to exporting, or adding a market, the top US exports data points to a simple order of questions: can you sell into North America duty-free, does your product match what Europe and East Asia buy, and does a retaliatory tariff change the math? The framework below walks through them.
Who Exports From the US?
The Census Bureau's exporter profile identified 271,250 US companies that exported goods in 2024. It classified 263,455 of them (97.1%) as small and medium-sized enterprises, a Census group that covers companies with fewer than 500 employees as well as certain companies whose employment is not known. Those smaller exporters shipped about $581 billion of goods. Most exporters stay focused: 60% shipped to just one country, 91,731 companies exported to Canada and 53,547 to Mexico. The International Trade Administration estimates exports supported almost 9.8 million US jobs in 2023, the latest year it reports.
"ITA's global network of trade professionals is working tirelessly to help American companies win contracts around the world, driving U.S. exports, strengthening American manufacturing, and supporting American workers..."
William Kimmitt, Under Secretary of Commerce for International Trade, International Trade Administration, October 22, 2026
How to Find US Export Data for Your Product
• Census Bureau trade data: monthly and annual export figures by product and country, including the end-use tables used in this guide.
• USA Trade Online: the Census Bureau's tool for detailed export data by Schedule B code, state and port. The redesigned USA Trade Online does not require an account to build reports.
• Classification: find the right Schedule B or HTS code before you ship, for example with our HTS code lookup.
• Market guides: the ITA's Country Commercial Guides cover demand and import rules by country.
For the other side of the trade balance, see the most imported products in the US.
How to Fund Export Orders While You Wait to Get Paid
Winning export orders can mean giving buyers time to pay, after you have already covered materials, production and freight. Financing is one way a small manufacturer can say yes to those terms. Texas crop-duster maker Air Tractor is one example:
"With help from EXIM loan guarantees and credit insurance, the program grew to the point where we now export over 70% of the planes we build."
Jim Hirsch, President and CEO, Air Tractor, Inc., Export-Import Bank of the United States, September 10, 2026
The right tool depends on your situation, from letters of credit for new buyers to pre-shipment finance when you need cash to make the goods (see the ITA's Trade Finance Guide):
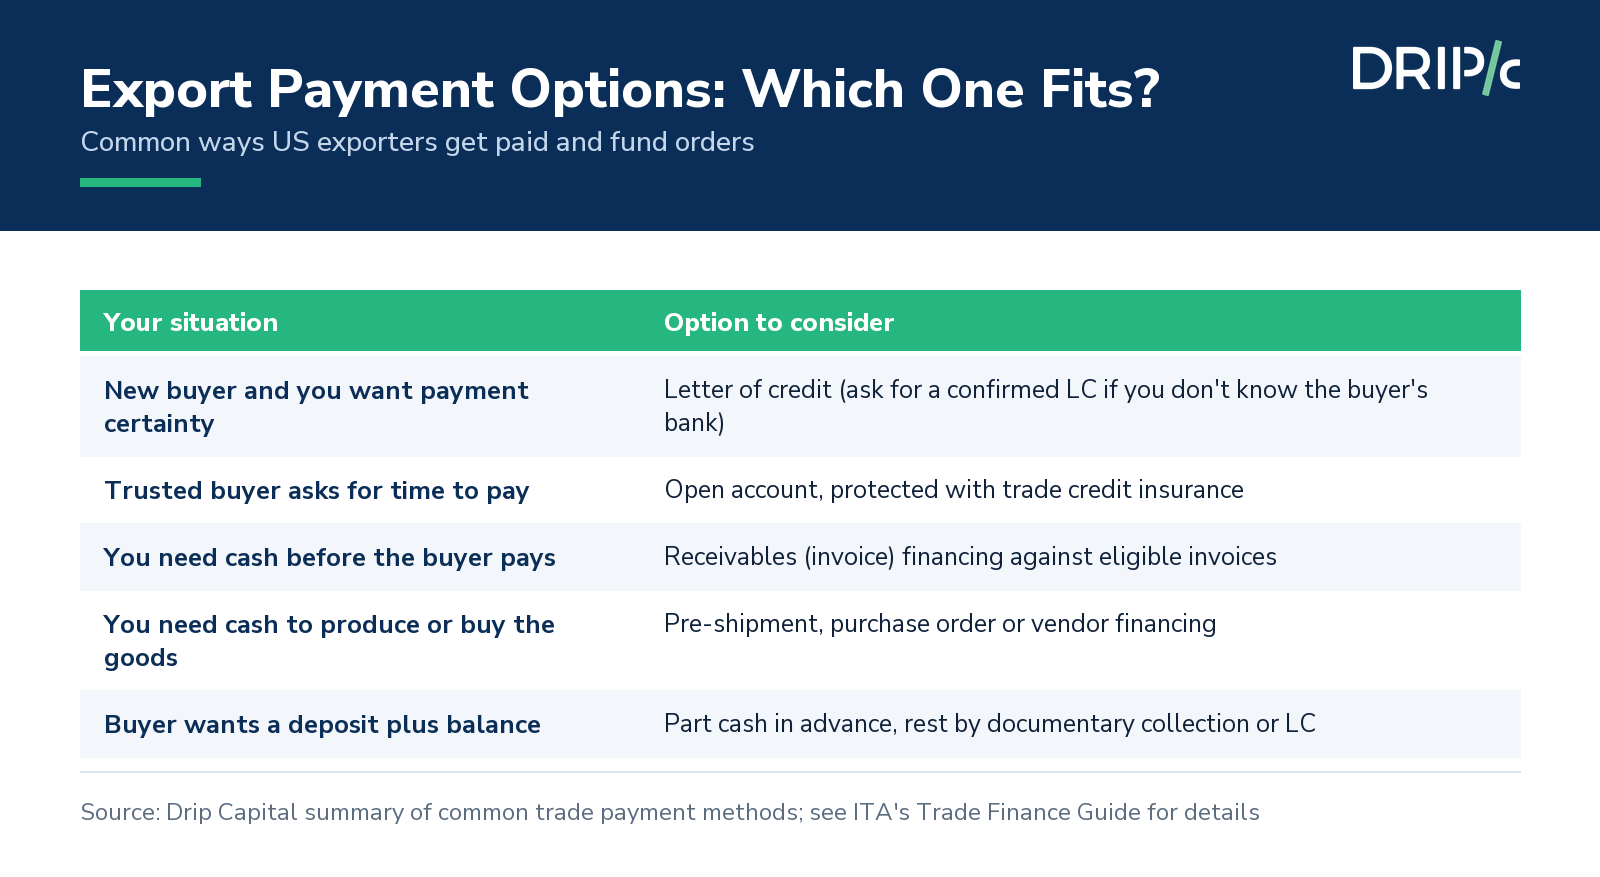
If paying vendors for materials and production is what ties up your cash before an export order ships, Drip Capital's Vendor Financing pays your vendors, in any country and currency, before or on shipment, and you repay in up to 90 days. After a one-time credit decision of about 48 hours, vendors are typically paid within 24 hours of you submitting their invoice, with no collateral required. Check if you qualify.
Frequently Asked Questions
What is the number one US export?
It depends on how products are grouped. In the Census end-use view, civilian aircraft, engines and parts were the largest US export in 2025 at $153.5 billion. In the HS category view, mineral fuels and oils (crude oil, refined fuels and natural gas) were largest at about $309 billion.
What are the top 5 exports of the United States?
Using 2025 Census end-use data, the top five were civilian aircraft, engines and parts ($153.5 billion), pharmaceutical preparations ($119.2 billion), crude oil ($98.7 billion), nonmonetary gold ($86.9 billion) and other petroleum products ($73.1 billion). In the broader HS chapter view, mineral fuels and oils ranked first instead.
How much does the US export per year?
The US exported $2.18 trillion of goods in 2025, up 5.7% from $2.06 trillion in 2024, on a Census basis. From January through September 2026, goods exports reached $1.85 trillion, up 14.3% from the same months of 2025. These are goods-only figures; services exports are counted separately.
Which country buys the most US exports?
Mexico bought the most US goods in 2025, $337.3 billion, just ahead of Canada at $333.6 billion. From January through September 2026, Mexico bought $297.6 billion versus Canada's $265.9 billion. China ranked third in 2025 at $106.0 billion, and together Mexico and Canada took 30.8% of all US goods exports.
What does the US export to China?
US goods exports to China fell 26% to $106.0 billion in 2025. The largest end-use categories were civilian aircraft, engines and parts ($15.9 billion) and semiconductors ($10.9 billion). Tariff treatment between the two countries is still being negotiated, so check current rates before quoting.
Are most US exporters small businesses?
Census identified 271,250 US exporting companies in 2024 and classified 97.1% of them as small and medium-sized enterprises, a group that includes companies with fewer than 500 employees and some with unknown employment. These smaller exporters shipped about $581 billion of goods.
How many US jobs depend on exports?
The International Trade Administration estimates that US exports of goods and services supported almost 9.8 million American jobs in 2023, the latest year in its official series. The estimate counts jobs supported directly and indirectly, including jobs at companies that supply exporters.