

Photo: medino marketing / Unsplash. Illustrative packaged merchandise.. Illustrative image.
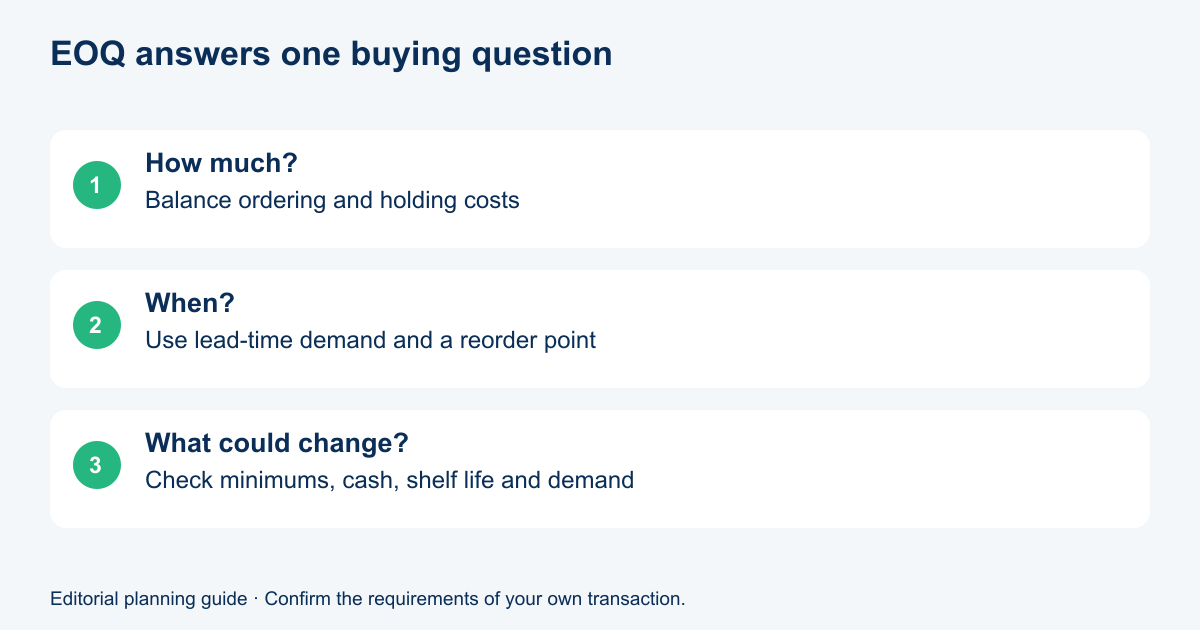
Buying more often adds ordering work. Buying more at once fills the warehouse and ties up cash. Economic order quantity gives you a starting point for balancing those two costs.
It is useful for repeat purchases with reasonably steady demand. It cannot tell you whether next season's product will sell, whether a factory will deliver on time, or whether you have enough cash to place the order. Use the calculation to improve a buying decision, then check it against the way your business actually operates.
What is economic order quantity?
Economic order quantity, or EOQ, is the order size that minimizes annual ordering and holding costs under a particular set of assumptions. It works on one item at a time. The basic model assumes stable demand, a fixed cost per order, constant holding cost, and replenishment without shortages.
The MIT inventory lecture explains this trade-off. Those assumptions are the reason to treat the result as a planning guide rather than an automatic purchase instruction.
The EOQ formula
EOQ formula: EOQ = √(2 × D × S ÷ H).
D is annual demand in units. S is the cost of placing and receiving one order. H is the annual cost of holding one unit. The answer is a quantity of units per order. Keep the time period consistent: annual demand needs annual holding cost.
Demand: use a realistic sales estimate
Start with expected unit sales or production usage for that item. Remove one-off orders where they are unlikely to repeat. If sales are strongly seasonal, an annual average can hide the months when demand disappears or doubles.
Ordering cost: count the work created by each order
Include costs that genuinely change with the number of orders: purchasing administration, receiving work, or a fixed shipment charge where relevant. Avoid counting the same freight expense in both ordering and holding cost.
Holding cost: look beyond warehouse rent
Consider storage, insurance, deterioration, obsolescence, and the cost of capital tied up in stock. If you start with a carrying-cost percentage, multiply it by unit cost to obtain an annual dollar amount per unit. Use your own evidence; no universal percentage fits every product.
EOQ calculator: a worked example
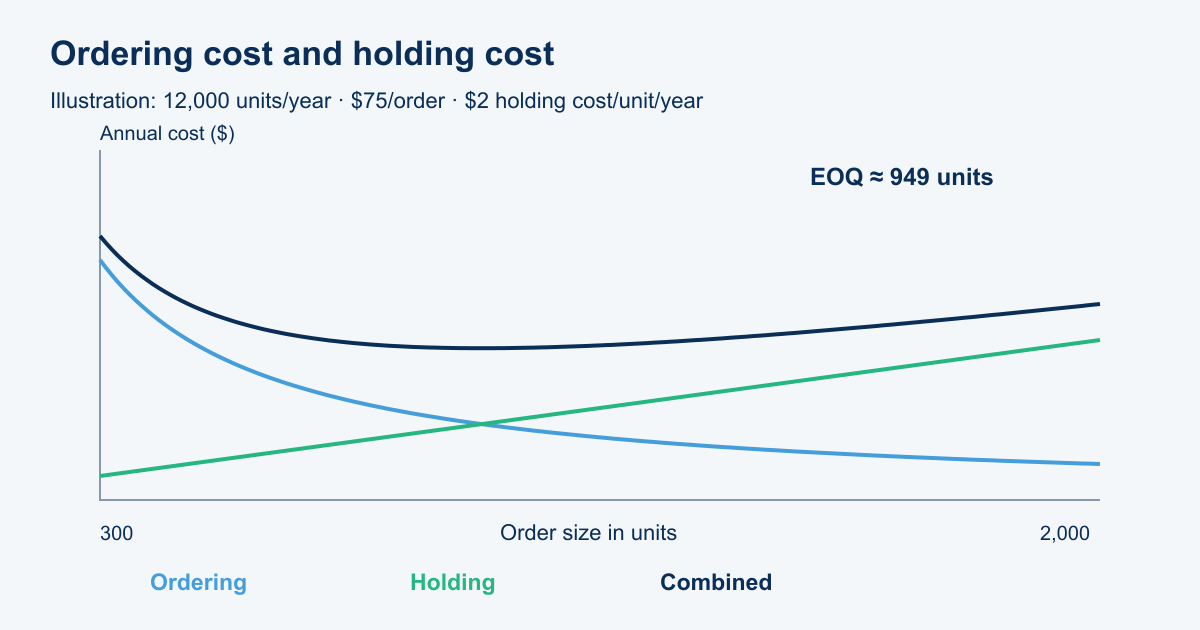
Suppose a wholesaler expects to sell 12,000 units annually. Each replenishment order costs $75 to arrange and receive. Holding one unit for a year costs $2. These are illustrative inputs.
The calculation is √(2 × 12,000 × 75 ÷ 2), giving roughly 949 units per order. That is about 13 replenishment orders annually. Before buying, compare nearby practical quantities such as 900, 960, or 1,000 units if carton sizes make those easier to handle.
What the result costs
At 949 units, annual ordering cost is approximately $948. Annual holding cost is approximately $949. Their combined total is about $1,897, allowing for rounding. This excludes the purchase cost of the goods, which is constant in the basic model when unit price does not change with order size.
Use the worksheet with your own figures
Enter annual units, cost per order, and annual holding cost per unit in the downloadable EOQ calculator (download the HTML file and open it in a browser). It also shows orders per year and the model's average cycle stock. The inputs must be positive numbers. A zero holding cost would make the basic calculation unsuitable.
A calculator result cannot replace inventory-turnover monitoring. One helps set a buying quantity; the other helps you understand how inventory moves through the business.

Compare the result with the amount you can fund through the whole order cycle, including deposits, freight, and the time customers take to pay. A low modeled annual cost can still require more cash upfront than the business can spare.
Ordering cost vs holding cost
The trade-off in ordering cost vs holding cost is easiest to see in the chart. Smaller batches increase the number of orders. Larger batches increase average stock. The lowest combined cost sits between those extremes under the stated assumptions.
The curve is often fairly flat near the minimum. A practical carton quantity close to EOQ may make more operational sense than chasing an exact unit count. Compare the actual cost difference before spending time negotiating a quantity the vendor cannot pack.
EOQ and reorder point answer different questions
EOQ helps with how much to order. The reorder point helps with when to order. A common starting calculation for the latter is expected demand during replenishment lead time plus safety stock.
For example, daily demand of 40 units across a 10-day replenishment period means 400 units of expected demand before the replacement arrives. Any safety stock is additional and should reflect your service goals and uncertainty. EOQ itself does not calculate that buffer.
When should you adjust the answer?
Minimum quantities and price breaks
If the vendor's minimum is above EOQ, compare alternative vendors, mixed orders, or scheduled releases. If a price discount is available for a larger quantity, compare purchase cost as well as ordering and holding costs. The basic EOQ result assumes a constant unit price.
Capacity and shelf life
Check usable storage space, product expiry, packaging changes, and the risk of slow-moving variants. A warehouse slot needed by a fast seller has value even if the slower item technically fits. Review your large-order funding plan before accepting a volume commitment.
Cash and delivery uncertainty
Separate production time, transit time, customs clearance, and receiving. A consistent factory lead time does not guarantee a consistent delivery date. Plan vendor deposits alongside the rest of the business's bills.
By the numbers: the example's planning limits
The sample uses 12,000 annual units, $75 per order, and $2 annual holding cost per unit. Its 949-unit result is an illustration, not a recommended order size or an industry benchmark. Change any input and recalculate.
Fund the purchase cycle with Drip Capital
Drip Capital's Vendor Financing pays vendors directly, with repayment terms of up to 90 days, subject to approval and terms. Assess financing against the purchase, sales, and collection timeline. Borrowing does not make an oversized order economical; it adds another cost and repayment commitment to evaluate.
Frequently asked questions
Is EOQ the same as minimum order quantity?
No. EOQ is a calculated planning quantity. A vendor sets its minimum order quantity as a commercial condition, which may be above or below your EOQ.
Can EOQ work for seasonal products?
The basic model is less useful when demand varies sharply. Use a seasonal purchasing plan and test smaller periods or scenarios with an inventory specialist rather than relying on one annual average.
Does EOQ include safety stock?
The basic average-cycle-stock calculation is order quantity divided by two. Safety stock is additional. Keep it separate so the model does not conceal the inventory you hold for uncertainty.